Configuring Nagios Part 1
Setting Up Hosts
Introduction
You followed the minimal installation of Linux, then proceeded to install monitoring software, now you are ready for the next step.
First off, What is nagios?
Before I jump on google, lookup Wikipedia or the nagios.org website, I wanted to come up with my own definition.
Nagios is network monitoring and alerting software.
It monitors your network using plugins, the plugins are written using a variety of programming and scripting languages, C, bash scripts, pearl, python, php, you can write plugins in basic, SQL, and assembly, it has to return an exit code and some text.
Based on the exit code, nagios can take action, like send an alert via email, sms, or text message.
That to me is what Nagios is, the magic is in the plugins. To be fair, nagios does a lot more things, there is a search feature, escalations, a map, and agents that can run on the host.
Nagios can be a beast if you try to take it all in at one time. I have been using nagios for close to 2 decades, and I still find interesting things for it to do.
With that said, I must break nagios down from one giant meal in to 5 edible parts:
- Part 1 – Monitoring Hosts
- Part 2 – Monitoring Services
- Part 3 – Plugins
- Part 4 – NRPE
- Part 5 – Notifications, Escalation, and Automated Scripts
What is host monitoring
Nagios monitors hosts and services. In this first article we are going to monitor hosts.
When you want to check if a machine on your network is up, you can do it several ways, you can try to connect to it with Remote Desktop if it is a Windows box, or SSH if it is a Linux box. If it is an appliance, we can check if a Web Management Interface is up. The most common way though, is to ping. It is common to open up a command line and type ping 192.168.1.1 to see if something is up. Or ping 8.8.8.8 as a way to see if your internet is up by pinging Google’s DNS server.
Setting Things Up
First thing we will do is tweak the environment a bit to make it easier to use.
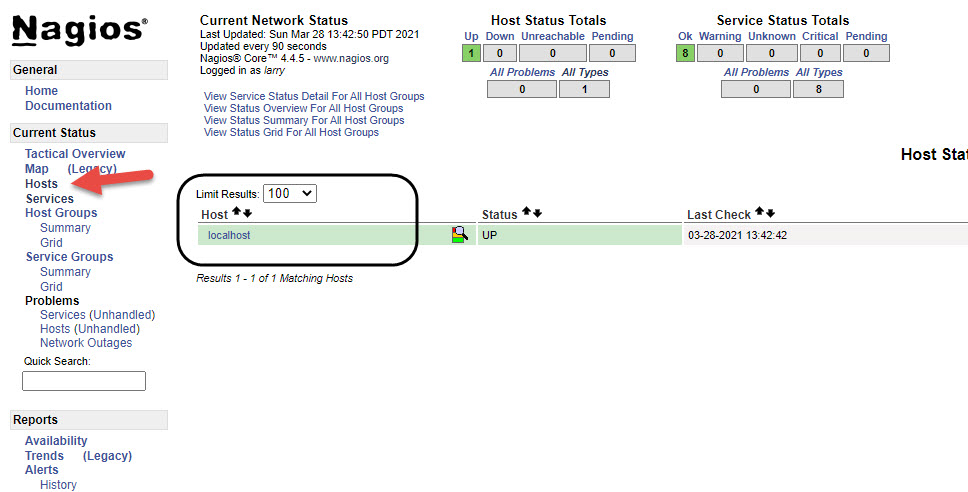
It is assumed you have installed nagios and have it running (see prior article). But all you see when you log in is localhost when you click on the Hosts section
Log in to the nagios box as root and go to /etc/nagios
Edit the nagios.cfg file
vi /etc/nagios/nagios.cfg
Got to around line 51 and uncomment the following
#cfg_dir=/etc/nagios/servers
#cfg_dir=/etc/nagios/printers
#cfg_dir=/etc/nagios/switches
#cfg_dir=/etc/nagios/routers
Remove the # sign and make it look like this
cfg_dir=/etc/nagios/servers
cfg_dir=/etc/nagios/printers
cfg_dir=/etc/nagios/switches
cfg_dir=/etc/nagios/routers
Now create folders with those names
mkdir /etc/nagios/servers
mkdir /etc/nagios/printers
mkdir /etc/nagios/switches
mkdir /etc/nagios/routers
Although you do not have to, it is good practice to give ownership of those folders (and any config files you create) nagios ownership.
chown nagios:nagios /etc/nagios/servers
chown nagios:nagios /etc/nagios/printers
chown nagios:nagios /etc/nagios/switches
chown nagios:nagios /etc/nagios/routers
IMPORTANT
Every time you make a change or add something to nagios, test the config first using the following command
nagios -v /etc/nagios/nagios.cfg
If there are no errors, you can restart the nagios service

systemctl restart nagios
Adding the first host
Go in to /etc/nagios/servers and create a file for your first host with the extension .cfg, the name can be anything, but make it easy on yourself and use the name of the host.
cd /etc/nagios/servers
vi alpha.cfg
In the example above, the server I will be monitoring is alpha, a raspberry pi in my lab that does DNS, Time and DHCP on my network.
Populate the file with the following content, modify your file to match what you have on your network.
define host{
        host_name               alpha
        address                 192.168.80.10
        max_check_attempts      10
        check_period            24x7
        contacts                larry,standard
        contact_groups          admins
        notification_interval   120
        notification_period     24x7
        }
This is how a host entry with the minimal parameters looks like in nagios. You can put all your hosts into a single file. But for management I recommend creating an individual file for each of your hosts.
Test your new config then restart nagios if there are no warnings
nagios -v /etc/nagios/nagios.cfg
systemctl restart nagios
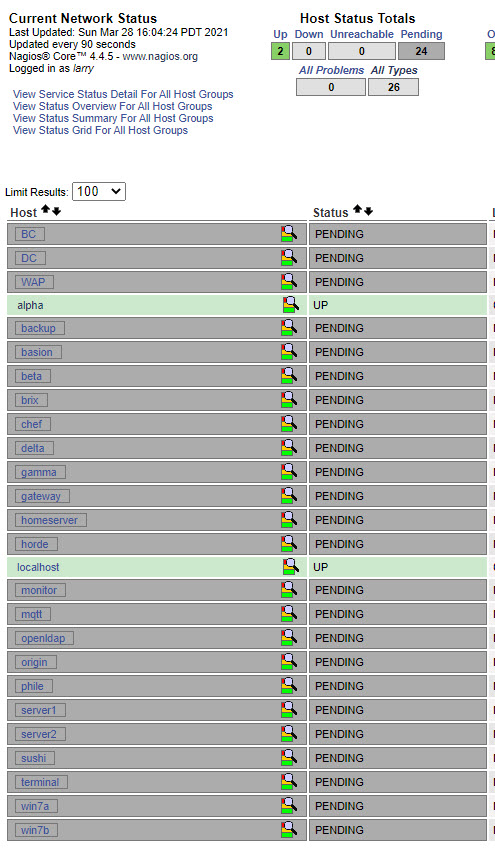
Go back to your browser and hit refresh, you will see two entries.
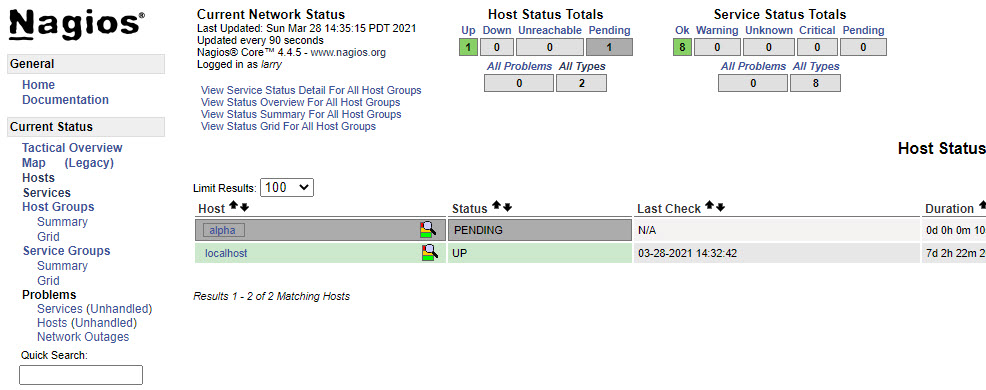
Normally within 5 minutes (the default), a check would have cycled through and the new host will go from pending to up. But there is a missing parameter, check_command, which is not required, but if it is not defined then the default is to not actively check the host. So we will add the check_command parameter with the check-host-alive value, so your config file looks like this.
define host{
        host_name               alpha
        address                 192.168.80.10
        max_check_attempts      10
        check_period            24x7
        check_command           check-host-alive
        contacts                larry,standard
        contact_groups          admins
        notification_interval   120
        notification_period     24x7
        }
Test your new config then restart nagios if there are no warnings
nagios -v /etc/nagios/nagios.cfg
systemctl restart nagios
Wait (max time is 5 minutes) and the status should switch to up.
Before you go nuts with this new information, read a bit more before adding all of your hosts.
The Host Configuration
I am going to look at the configuration file a bit deeper. If you want the official document and all of the various parameters, see
https://assets.nagios.com/downloads/nagioscore/docs/nagioscore/3/en/objectdefinitions.html#host
- host_name – is a short simple name used to identify itself throughout the nagios configs.
- address – can be an ip or FQDN
- max_check_attempts – This is how many times the check will had
- check_period – This is the time when checks happen, these timelines are defined in /etc/nagios/objects/timeperiods.cfg with 24×7 a stock value to continuously check
- check_command – This value is the command used to check if a host is alive or not. Most use a ping and a ping is defined as check-host-alive in /etc/nagios/objects/commands.cfg, you will see it uses the check_ping command.
- contacts – larry,standard , this is a comma separated list of who should be notified when this host goes up or down. You can specify BOTH OR EITHER contacts or contact_groups, but AT LEAST ONE must be defined.
- contact_groups – this is a group of contacts defined in /etc/nagios/objects/contacts.cfg, see contacts above
- notification_interval – This is how many minutes to wait before sending a notification (caveat, there is a value in the configs called interval_length with a value of 60, which is how many seconds in a minute, so if you want a minute to 3600, then the notification interval will be multiplied but 3600 to give you the time in seconds between notices, keep it simple leave interval_length a 60)
- notification_period – where check_period is the times a server is checked, notification_period is the time notices are sent. You may have check_period set to 24×7, but only need to be notified during business hours if there is an outage.
These are the minimum values needed (other than check_command)
Hold on for one more topic before you go ahead and create entries for all your hosts.
The Host Template
You can simply create a master file and copy the file for each host you are monitoring, then change the host_name and address to match the host.
The problem is if you change something, say the contacts or the contact_groups, it is a pain to iterate through each file and change the contacts value.
So setting up a host template (located in /etc/nagios/objects/templates.cfg) may be easier.
Edit /etc/nagios/objects/templates.cfg
vi /etc/nagios/objects/templates.cfg
Look for the generic-host entry and make the following changes
define host {
    name                            generic-host
    notifications_enabled           1
    event_handler_enabled           1
    flap_detection_enabled          1
    process_perf_data               1
    retain_status_information       1
    retain_nonstatus_information    1
    notification_period             24x7
    register                        0      ; JUST A TEMPLATE!
    max_check_attempts              10
    check_period                    24x7
    check_command                   check-host-alive
    contacts                        larry,standard
    contact_groups                  admins
    notification_interval           120
}
Modify your host to use the template, you can override the template values if you need to. But now you have a nice short sweet host entry.
define host{
        use                     generic-host
        host_name               alpha
        alias                   Main DHCP DNS Server
        address                 192.168.80.10
        }
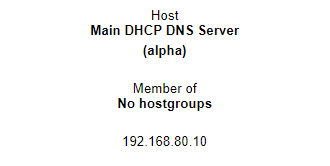
Note how I added an alias
Test your new config then restart nagios if there are no warnings
nagios -v /etc/nagios/nagios.cfg
systemctl restart nagios
Then go back to the browser
In 5 minutes you should see a new host that is OK
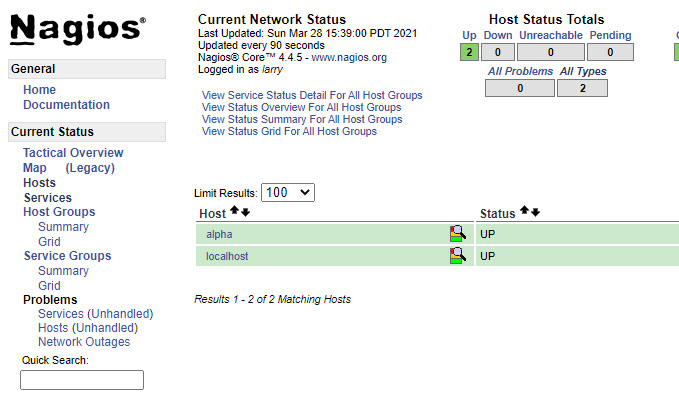
And if you click the new host, you will see some interesting information at the top.
Go nuts add entries for all your hosts, make it easy on yourself and simply copy and modify the existing file.
When you are done, test your new config then restart nagios if there are no warnings
nagios -v /etc/nagios/nagios.cfg
systemctl restart nagios
Host Groups
Congratulations you now have a bunch of servers being monitors. One thing you might want to do is organize them by duty.
Similar to how we created a folder for servers we are going to create one for hostgroups
mkdir /etc/nagios/hostgroups
chown nagios:nagios /etc/nagios/hostgroups
Then modify /etc/nagios/nagios.cfg
vi /etc/nagios/nagios.cfg
And add
cfg_dir=/etc/nagios/hostgroups
Test your new config then restart nagios if there are no warnings
nagios -v /etc/nagios/nagios.cfg
systemctl restart nagios
Now you can create hostgroups cfg files for the different servers, the format is
define hostgroup {
    hostgroup_name     linux-servers  ; The name of the hostgroup
    alias              Linux Servers  ; Long name of the group
    members            localhost      ; Comma separated list of hosts
}
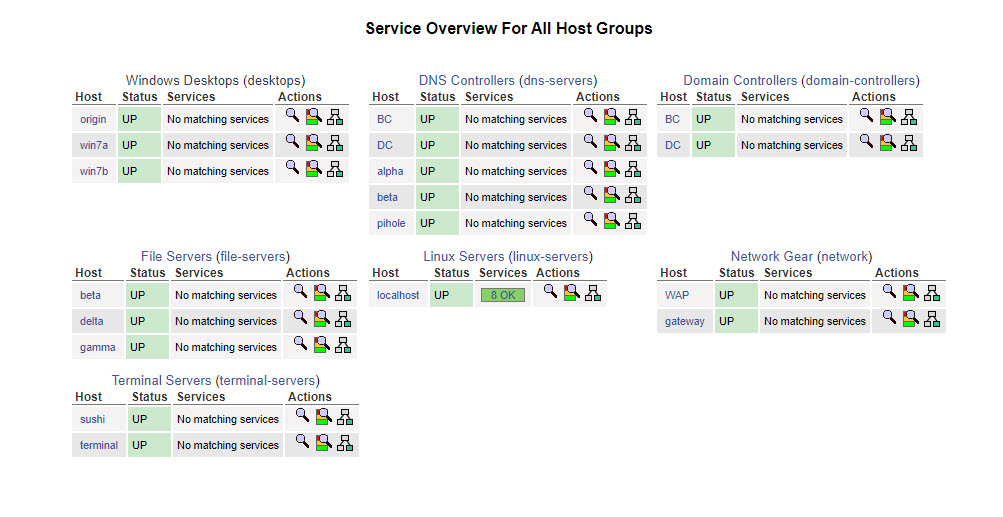
Here is an example of my hostgroup entries
define hostgroup {
     hostgroup_name     domain-controllers
     alias              Domain Controllers
     members            DC,BC
 }
 define hostgroup {
     hostgroup_name     dns-servers
     alias              DNS Controllers
     members            DC,BC,alpha,beta,pihole
 }
 define hostgroup {
     hostgroup_name     network
     alias              Network Gear
     members            gateway,wap
 }
 define hostgroup {
     hostgroup_name     file-servers
     alias              File Servers
     members            beta,gamma,delta
 }
 define hostgroup {
     hostgroup_name     desktops
     alias              Windows Desktops
     members            origin, win7a, win7b
 }
 define hostgroup {
     hostgroup_name     terminal-servers
     alias              Terminal Servers
     members            sushi,terminal
 }
Here is one of the hostgroup views
This concludes part 1 of the Configuring Nagios series.
