Grafana, Nagios and Stuff
In this article, I am going to walk through installing some monitoring software on a CentOS 7 box.
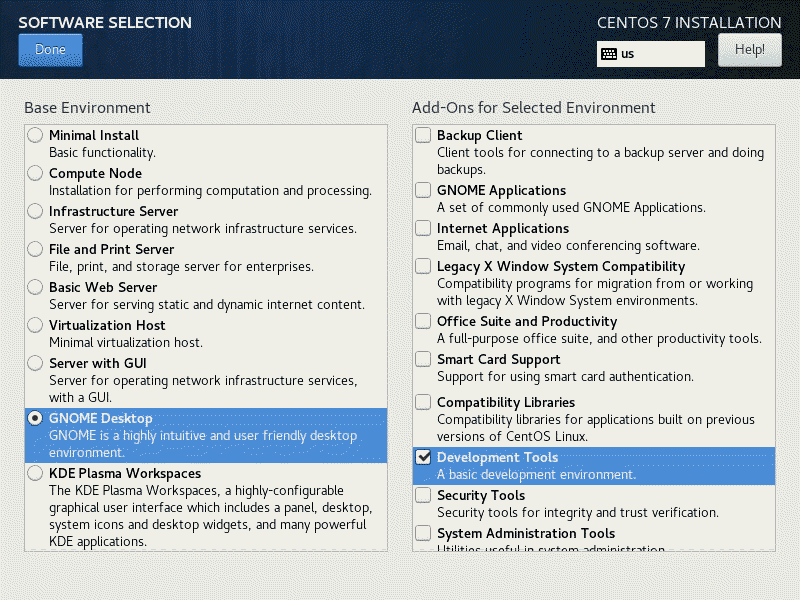
Start with the the base install of CentOS is described here
https://my.apolonio.tech/?p=78
but upgraded with yum update so you would end up with a CentOS 7.9.2009 instance.
All commands are run with a user that has sudo permissions unless otherwise noted.
Install Grafana
Add the Grafana repo in to your yum repo list
cd /etc/yum.repos.dsudo wget https://my.apolonio.tech/linux/grafana.repo
Install it
sudo yum -y install grafana
Enable it and start it up, this will make it available on reboot
sudo systemctl enable --now grafana-server
At this point you should be able to log in to Grafana with a web browser using port 3000
http://grafana.makernet.local:3000/login
Username: admin Password: admin
You will be prompted to change it.
Note: If you ever forget the admin password for Grafana use the following command to reset the password to newpassword
grafana-cli admin reset-admin-password newpassword
Install InfluxDB
Add the InfluxDB repo to your yum repo list
cd /etc/yum.repos.d
sudo wget https://my.apolonio.tech/linux/influxdb.repo
Install it
sudo yum install influxdb
Start it up
sudo systemctl enable --now influxdb
Next run the influx command
influx
And create a the telegraf database with the appropriate usernames, passwords, and permissions
CREATE DATABASE "telegraf"
CREATE USER "admin" WITH PASSWORD 'supersecretpassword'
CREATE USER "telegraf" WITH PASSWORD 'secretpassword'
GRANT ALL ON "telegraf" TO "admin"
GRANT READ ON "telegraf" TO "telegraf"
GRANT WRITE ON "telegraf" TO "telegraf"
EXIT
Install Prometheus
Go to your home directory and download the Prometheus package.
Go to opt and unroll the package, rename to prometheus
cd /opt
sudo tar zxpvf ~/prometheus-2.22.1.linux-amd64.tar.gz
sudo mv prometheus-2.22.1.linux-amd64 prometheus
Create a user account for Prometheus to run as and give it ownership of the Prometheus install
sudo mkdir -p /opt/prometheus/var/lib/
sudo useradd -rs /bin/false prometheus
sudo chown -R prometheus:prometheus /opt/prometheus
Create a system service
sudo vi /etc/systemd/system/prometheus.service
With the following contents
[Unit]
Description=Prometheus
After=network.target
[Service]
User=prometheus
Group=prometheus
Type=simple
ExecStart=/opt/prometheus/prometheus \
--config.file /opt/prometheus/prometheus.yml \
--storage.tsdb.path /opt/prometheus/var/lib/ \
--web.console.templates=/opt/prometheus/console \
--web.console.libraries=/opt/prometheus/console_libraries
[Install]
WantedBy=multi-user.target
And reload the daemon, enable and start Prometheus
sudo systemctl daemon-reload
sudo systemctl enable --now prometheus
Install Loki
Go back to your home directory and download the Loki package
cd
wget https://github.com/grafana/loki/releases/download/v1.6.1/loki-linux-amd64.zip
Go to opt, create the loki folder and unzip the package in to it
sudo mkdir -p /opt/loki
cd /opt/loki
sudo unzip ~/loki-linux-amd64.zip
While you are in the /opt/loki folder, create a loki config file
sudo vi /opt/loki/config-loki.yml
With the following
auth_enabled: false
server:
  http_listen_port: 3100
ingester:
  lifecycler:
    address: 127.0.0.1
    ring:
      kvstore:
        store: inmemory
      replication_factor: 1
    final_sleep: 0s
  chunk_idle_period: 5m
  chunk_retain_period: 30s
  max_transfer_retries: 0
schema_config:
  configs:
    - from: 2018-04-15
      store: boltdb
      object_store: filesystem
      schema: v11
      index:
        prefix: index_
        period: 168h
storage_config:
  boltdb:
    directory: /tmp/loki/index
  filesystem:
    directory: /tmp/loki/chunks
limits_config:
  enforce_metric_name: false
  reject_old_samples: true
  reject_old_samples_max_age: 168h
chunk_store_config:
  max_look_back_period: 0s
table_manager:
  retention_deletes_enabled: false
  retention_period: 0s
Create a user account for loki and give it ownership of the loki directory
sudo useradd -rs /bin/false loki
sudo chown -R loki.loki /opt/loki
Create a systemd service
sudo vi /etc/systemd/system/loki.service
With the following content
[Unit]
Description=Loki service
After=network.target
[Service]
Type=simple
User=loki
Group=loki
ExecStart=/opt/loki/loki-linux-amd64 -config.file /opt/loki/config-loki.yml
[Install]
WantedBy=multi-user.target
And reload the daemon, enable and start Prometheus
sudo systemctl daemon-reload
sudo systemctl enable --now loki
Install Nagios
Nagios is in the epel repo, install the repo first then install nagios and plugins
sudo yum -y install epel-release
sudo yum -y install nagios nagios-plugins-all
Nagios uses basic auth for authentication, create password file and users, the first command creates the password file and adds the user larry, the second, simply adds the user standard to that same file.
sudo htpasswd -c /etc/nagios/passwd larrystandard
sudo htpasswd /etc/nagios/passwd
Create a file in the root of web server so there are no errors then restart apache
sudo touch /var/www/html/index.html
sudo systemctl restart httpd
Add the users as contacts in the contacts file
sudo vi /etc/nagios/objects/contacts.cfg
Here is a sample of how the users look
define contact {
    contact_name            larry
    use                     generic-contact
    alias                   Larry Apolonio
    email                   larry@makernet.local
}
define contact {
    contact_name            standard
    use                     generic-contact
    alias                   Standard Account
    email                   standard@makernet.local
}
Then add modify the group to add new users as administrators
define contactgroup {
    contactgroup_name       admins
    alias                   Nagios Administrators
    members                 nagiosadmin,larry,standard
}
Verify that the nagios config file is correct, you should always verify after you make some configuration changes.
sudo nagios -v /etc/nagios/nagios.cfg
Enable nagios and start the daemon
sudo systemctl enable --now nagios
Validation
At this point run the following commands to check if all the services are running correctly
sudo systemctl status nagios
sudo systemctl status loki
sudo systemctl status influxdb
sudo systemctl status prometheus
sudo systemctl status grafana-server
sudo systemctl status httpd
Furthermore use a browser to check that these services are OK
- Grafana http://grafana.makernet.local:3000
- Prometheus http://grafana.makernet.local:9090
- Nagios http://grafana.makernet.local/nagios
The following two services should give you a 404 error which is OK, it means something is reponding on those ports, it is a problem if you get The site can’t be reached and/or refused to connect.
Protect Service with SSL
It is highly recommended you protect your services with SSL/TLS encryption. Since there are a variety of ways that an SSL certificate gets created, the steps in creating a certificate and key pair will not be outlined here.
It is assumed the reader know about certificates and keys and if there is an intermediate, how to add them as a chain file or combine them.
Certs here are PEM encoded and the examples used do not have an intermediate.
Apache
Apache is the web server used by nagios and will serve as a proxy for loki and Prometheus. So make sure mod ssl is installed, and the auto generated cert and keys are replaced with signed ones.
sudo yum -y install mod_ssl
Use cat to paste the cert and keys in to the locations below, or scp/sftp to those locations.
sudo su -
cat > /etc/pki/tls/certs/localhost.crt
cat > /etc/pki/tls/private/localhost.key
exit
Copy the certs the locations used by Grafana and influxdb which will use the cert and keys directly
sudo cp -p /etc/pki/tls/certs/localhost.crt /etc/grafana/server.crt
sudo cp -p /etc/pki/tls/private/localhost.key /etc/grafana/server.key
sudo chown grafana:root /etc/grafana/server.crt
sudo chown grafana:root /etc/grafana/server.key
sudo cp -p /etc/pki/tls/certs/localhost.crt /etc/influxdb/server.crt
sudo cp -p /etc/pki/tls/private/localhost.key /etc/influxdb/server.key
sudo chown influxdb:root /etc/influxdb/server.crt
sudo chown influxdb:root /etc/influxdb/server.key
Grafana
Edit the Grafana config file
sudo vi /etc/grafana/grafana.ini
Look for the server section, change the protocol to https and point the cert_file and cert_key parameters to the appropriate location
[server]
# Protocol (http, https, h2, socket)
protocol = https
cert_file = /etc/grafana/server.crt
cert_key = /etc/grafana/server.key
Restart Grafana
sudo systemctl restart grafana-server
InfluxDB
Edit the InfluxDB File
sudo vi /etc/influxdb/influxdb.conf
In the http section, enable https and point to the appropriate cert and key files
[http]
  https-enabled = true
  https-certificate = "/etc/influxdb/server.crt"
  https-private-key = "/etc/influxdb/server.key"
Restart InfluxDB
sudo systemctl restart influxdb
Nagios
sudo vi /etc/httpd/conf.d/nagios.conf
uncomment out the SSLRequireSSL (Remove the # from 2 locations)
Restart the web service
sudo systemctl restart httpd
Prometheus
Create a Prometheus apache config file
sudo vi /etc/httpd/conf.d/prometheus.conf
Here are the contents
Listen 9443
NameVirtualHost *:9443
<VirtualHost *:9443>
    SSLEngine on
    SSLProxyEngine On
    ProxyRequests Off
    ProxyPreserveHost On
    SSLCertificateFile /etc/pki/tls/certs/localhost.crt
    SSLCertificateKeyFile /etc/pki/tls/private/localhost.key
    ProxyPass / http://grafana.makernet.local:9090/
    ProxyPassReverse / http://grafana.makernet.local:9090/
</VirtualHost>
Restart the web service
sudo systemctl restart httpd
Loki
Create a loki apache config file
sudo vi /etc/httpd/conf.d/loki.conf
Here are the contents
Listen 9100
NameVirtualHost *:9100
<VirtualHost *:9100>
    SSLEngine on
    SSLProxyEngine On
    ProxyRequests Off
    ProxyPreserveHost On
    SSLCertificateFile /etc/pki/tls/certs/localhost.crt
    SSLCertificateKeyFile /etc/pki/tls/private/localhost.key
    ProxyPass / http://localhost:3100/
    ProxyPassReverse / http://localhost:3100/
</VirtualHost>
Restart the web service
sudo systemctl restart httpd
SSL Validation
Here are example URLs to test
- Loki https://grafana.makernet.local:9100
- Prometheus https://grafana.makernet.local:9443
- InfluxDB https://grafana.makernet.local:8086
- Grafana https://grafana.makernet.local:3000
- Nagios https://grafana.makernet.local/nagios
Note that the unencrypted ports for Loki and Prometheus are still accessible. You can either block those ports with firewalld or change the config to only listen to localhost


1 Response
[…] followed the minimal installation of Linux, then proceeded to install monitoring software, now you are ready for the next […]